The USDA Plant Hardiness Zones, commonly known as USDA Garden Zones, provide a guide for gardeners and farmers to identify which plants are most likely to thrive at a particular location based on the area's climate conditions. These zones are determined by the average minimum winter temperature of a region, and they are a critical resource for understanding the types of plants that can survive in various climates across the United States and parts of Canada and Mexico. Here’s an extensive summary:
The USDA Plant Hardiness Zone Map divides North America into 13 zones, with each zone representing a 10°F difference in the average minimum annual winter temperature. Each zone is further divided into two subzones (a and b) to provide more precise data, with each subzone representing a 5°F difference. The zones range from Zone 1, which is the coldest, to Zone 13, the warmest. The map helps gardeners know which plants are likely to survive winter in their region.
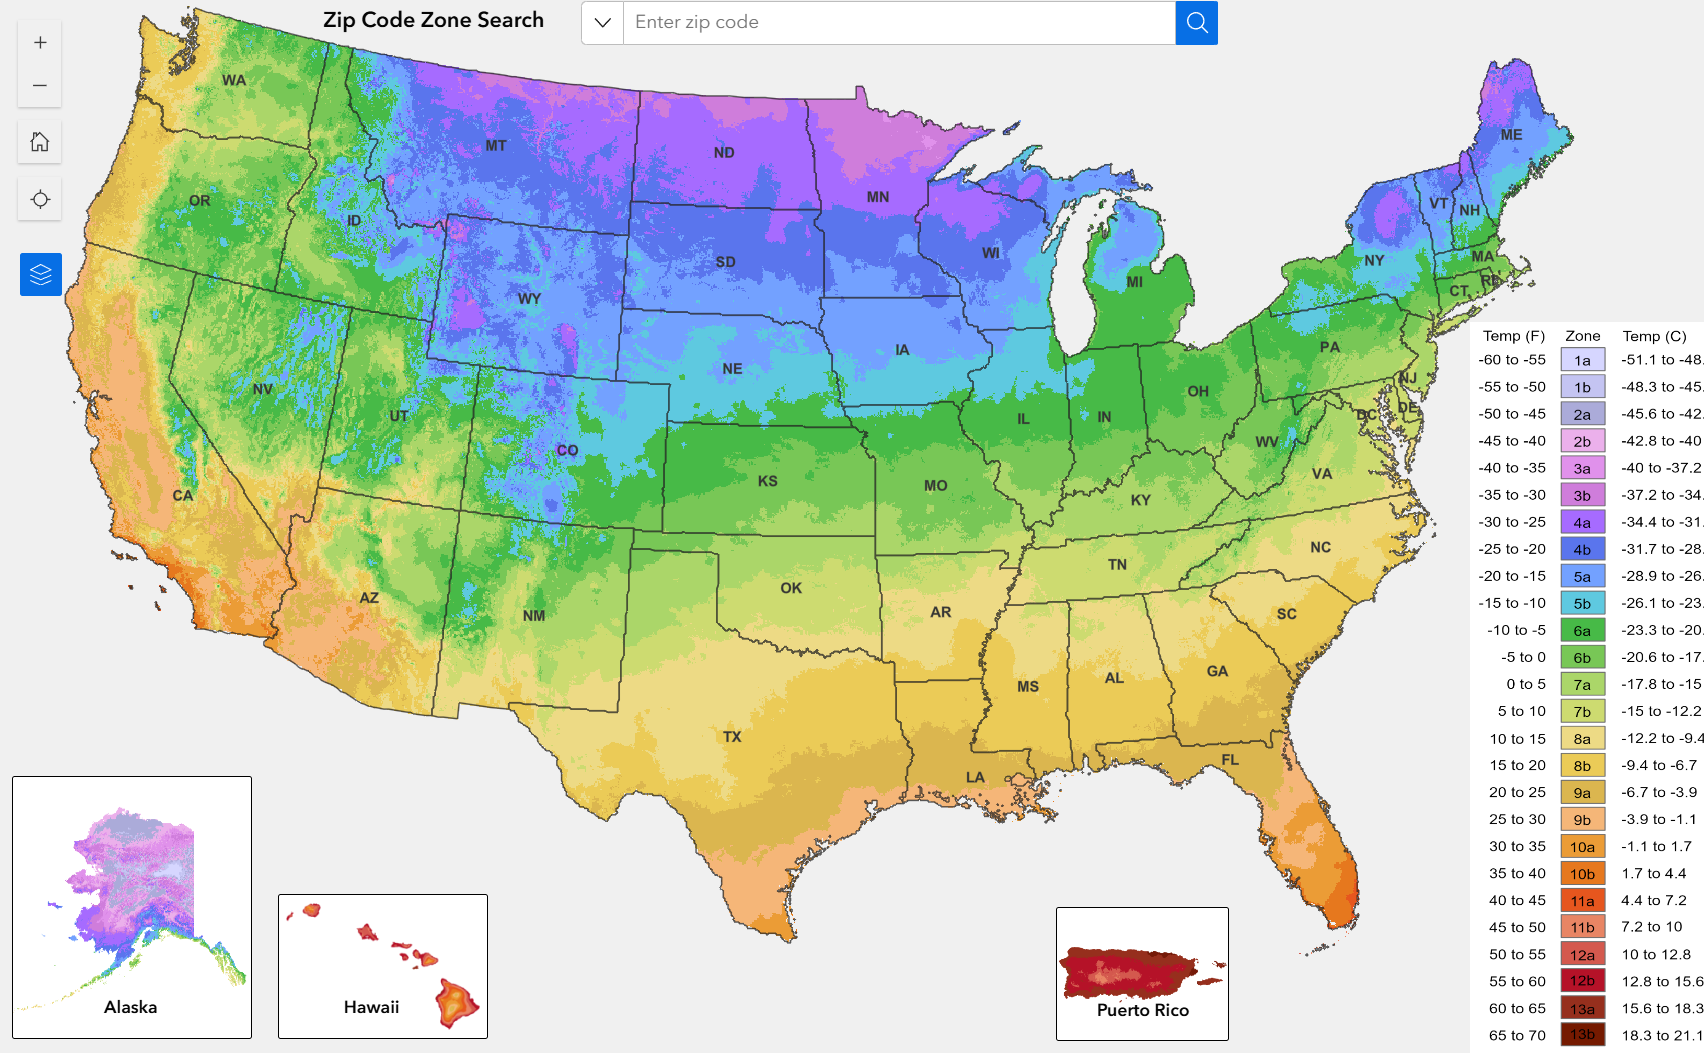
This map is from the USDA web site.
How the Zones Are Calculated
- Minimum Temperature: Zones are based on the average lowest temperature recorded each year over a 30-year period. The coldest areas are in Zone 1, with average minimum temperatures of -60°F to -50°F, while the warmest areas are in Zone 13, with temperatures above 60°F.
- Climate Data Collection: The USDA bases its data on weather stations across the country. The data was last updated in 2012 using temperature information from 1976 to 2005.
- Regional Variations: Geographic features such as elevation, proximity to bodies of water, and urban heat islands can also influence local climate conditions, leading to microclimates within zones.
Uses of the USDA Hardiness Zone Map
- Plant Selection: Gardeners can choose plants that are appropriate for their region. For example, someone in Zone 5 can plant species that are hardy to at least -20°F, but they would avoid tropical plants that require warm winters.
- Garden Planning: The zones help in determining the best planting and harvest times, especially for annual vegetables, fruits, and flowers. Knowing the zone can also help gardeners extend the growing season by selecting cold-tolerant or heat-tolerant varieties.
- Guidance for Nurseries: Nurseries and seed companies often label plants with the zones where they are expected to thrive. This information is crucial for gardeners to make informed purchasing decisions.
Limitations of USDA Garden Zones
- Microclimates: The USDA zone map provides a broad overview, but it doesn’t account for specific microclimates. Factors such as urban heat, elevation, wind exposure, and soil conditions can affect how well a plant will thrive in a particular area.
- Other Factors: Hardiness zones are based solely on temperature, but they don’t consider other climate factors that affect plants, such as humidity, rainfall, soil moisture, and day length. For example, a plant that thrives in Zone 9 in California’s dry climate may not do as well in Florida’s more humid conditions.
- Heat Zones: While the USDA zones focus on minimum winter temperatures, plants are also affected by maximum summer temperatures. The American Horticultural Society created the Plant Heat-Zone Map, which complements the USDA zones by showing how well plants tolerate summer heat.
Updates and Future Revisions
The USDA periodically updates the Plant Hardiness Zone Map as climate conditions change over time. Global climate change has affected average temperatures across many regions, which could lead to shifts in hardiness zones. Gardeners may notice that some areas are now in warmer zones than they were in past decades, affecting plant selection and growing strategies.
Conclusion
The USDA Plant Hardiness Zones are a valuable resource for gardeners, landscapers, and farmers to help select the best plants for their region based on average winter temperatures. While useful, it’s important to consider other local climate factors and microclimates when planning a garden.